Discover everything about Infographics: definition, examples, and top tools
What is an infographic?
The Royal Spanish Academy (RAE) defines it as "a graphical representation that supports press information." In other words, infographics facilitate the expression of complex data or knowledge in an attractive and concise visual way, conveying easily understandable messages.
Moreover, they can contain images, text, and eye-catching icons, organized and structured so people can navigate through the content intuitively.
Most infographics are shareable on online platforms such as blogs, websites, or social media. This makes it a versatile tool for anyone working as a freelancer and wanting to visibly improve on the web.
Why should every freelancer use creative infographics?
Like a concept map, infographics simplify the understanding of any information, attracting clients more quickly. By using this visual format as freelancers, you cab communicate a proposal more effectively, thereby building trust. And if you opt for creative and truly impactful infographics, you will differentiate yourself from the competition.
Infographics can be a practical resource for improving your visibility and finding more freelance opportunities in this market environment, and can be as beneficial as writing an essay to showcase your skills and strengthen your personal branding.
Maybe infographics aren't in your area of expertise, but want to earn money?
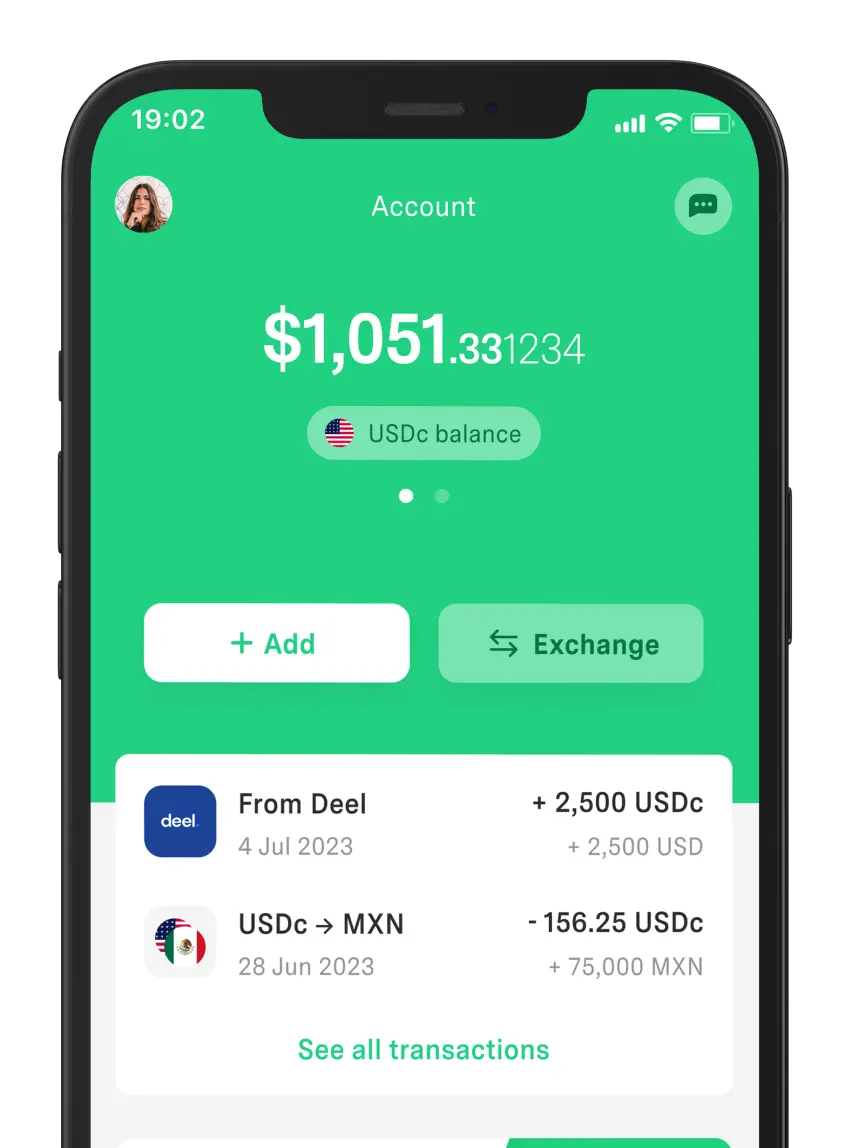
Try pages with simple templates and generate extra income without leaving home. Once you learn, upload your work to a freelancing platform and get paid in dollars or pesos through DolarApp, the app where you save on exchange rates.
Regardless of your specific professions, if you have the ability to create interesting infographics, you can offer it as an additional service - even as a freelance writer or copywriter.
Types of infographics
There is a wide variety of infographics and the type of infographic to use for your specific case depends on what you want to convey.
Infographics are divided into multiple types; some of the most popular ones are:
Statistical.
Informative.
Comparative.
Hierarchical.
Geographical.
Process.
List.
Timeline.
Product.
Map.
Several of these infographic types have become an invaluable resource for freelancers who opt for the home office. For example, if you are a digital marketing specialist, you can use creative infographics to explain the company's achievements or advertise a product.
Regardless of your specific use case, it is possible to enhance your online presence and elevate your freelance profile.
Step-by-step guide to creating an impactful infographic
Now that you know what an infographic is and why you should use it as a key tool as a freelancer, let's explore how how to create effective infographics:
1. Define your objective
The first step is to identify the main purpose of your infographic which addresses a specific problem. Formulate a list of key questions, such as what data and time period will be displayed.
Collect key information that addresses the defined questions and statistics that support your message. Use the internet for support to find what you need and organize everything logically and sequentially.
3. Visualize how the data will appear
Imagine the visual presentation of the information in your creative infographic. Decide what type of visualization it will be, for example, choose whether to communicate, compare, or show statistics. Choose a clear title that anticipates to the viewer what the chart will resolve.
4. Design and Sketch
Before choosing a design, sketch it on a blank sheet of paper. Include graphics, images, and colors that complement your message and increase clarity. Organize in grids or lines according to the content.
5. Apply the design
Once you have everything defined, choose an attractive design and add the data with clear and easy-to-read typography. Don't forget to check the accuracy of the information and make final adjustments.
Following these steps, you can create creative, attractive, and effective infographics to express ideas.
On the internet, you can find many pages that provide creative infographics and pre-made templates to replace data.
Among the best online tools are:
Canva: One of the most well-known sites for creating infographics is Canva. It offers a variety of templates and customization features ideal for effective data visualization. It is a powerful tool for creating simple infographics in minutes.
Piktochart: You can also choose Piktochart, which offers templates to create unique and customized infographics. Here you can personalize your brand in seconds and tell visual stories in a striking way. Ideal for freelancers who want to highlight the benefits of their services.
Genially: Another versatile tool is Genially, where creativity harmonizes with interactivity. This platform allows you to design infographics and incorporate interactive elements, such as animations and even videos. Its designs can be easily customized with your content and brand elements.
Venngage: Are you a freelancer who knows nothing about design? With Venngage, you don't need to. The site facilitates its creation with hundreds of templates and visual elements. It offers all types of infographics in its menu. Its intuitive approach and diversity of options simplify the design process, making it accessible and efficient.
These are just some of the most popular options, all you need to do is choose the one that suits your preferences.
Infographic examples: top 10 Infographics in Spanish
Now that you know what is necessary to start creating infographics, you just have to choose which type suits you. For this reason, we want to give you a push with the following 10 infographic examples.
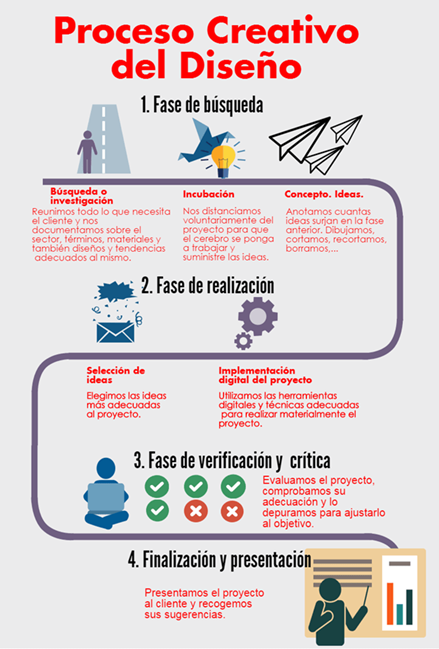
1. Process infographics. Creative design process, Frogx3.
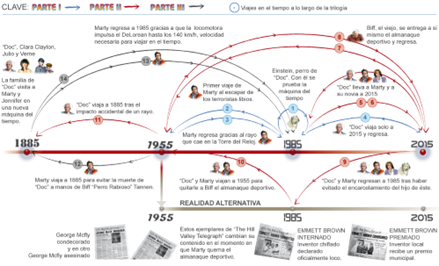
2. Timeline infographic. Time travel through the three deliveries, El Mundo.
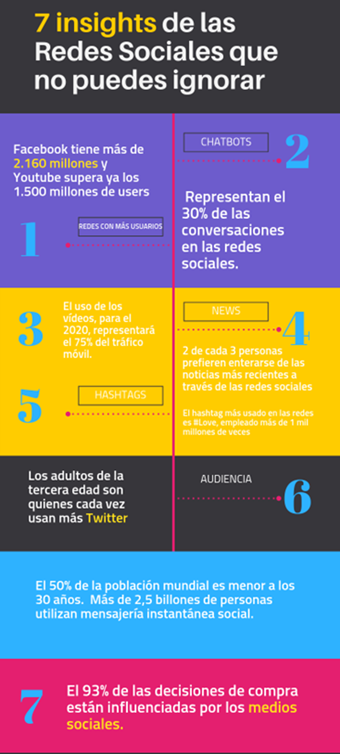
3. Statistical infographic. 7 Social media insights you can't ignore, Topic Flower.
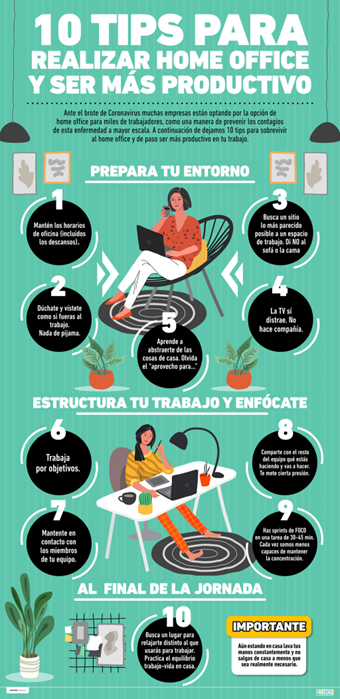
4. Informative infographic. 10 tips to perform home office and be more productive, Paredro.
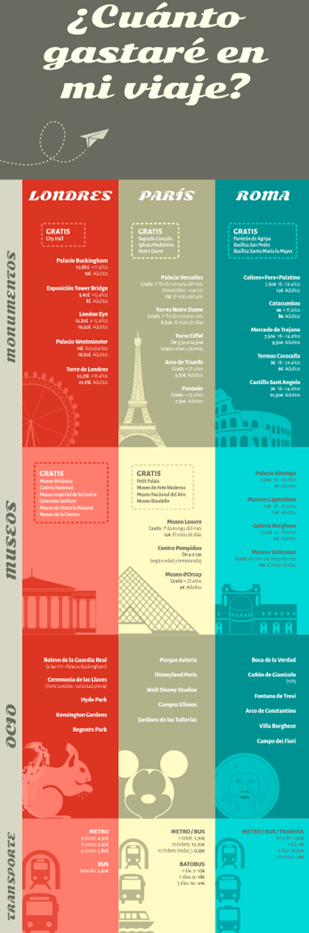
5. Comparative infographic. How much will I spend on my trip?, Wuking.
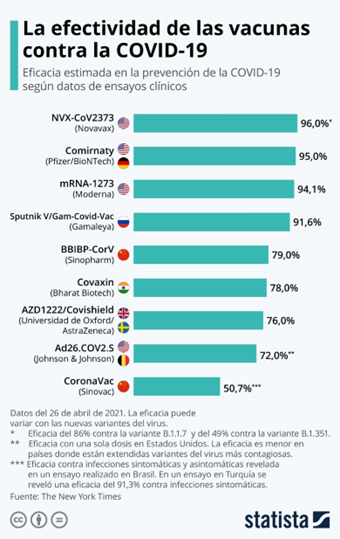
6. Statistical infographic. The effectiveness of vaccines against COVID-19, Statista.
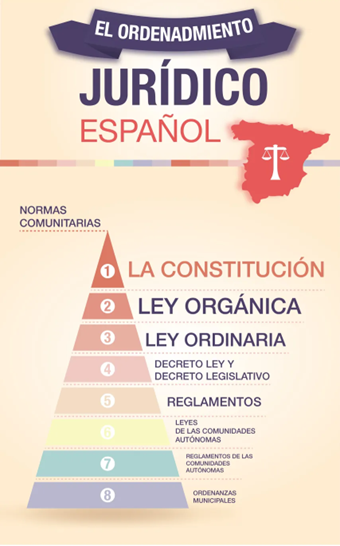
7. Hierarchical infographics. The Spanish legal system, Ticsyformacion.
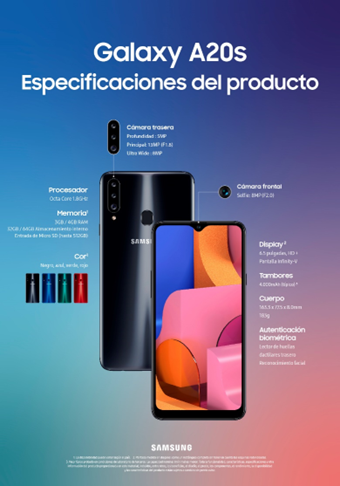
8. Product infographic. Galaxy A20s product specifications, Samsung.
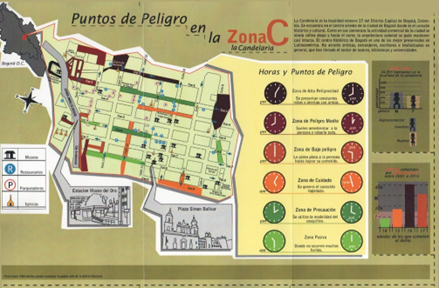
9. Geographic infographics. Danger points in the area C la Candelaria, infografia-cun.
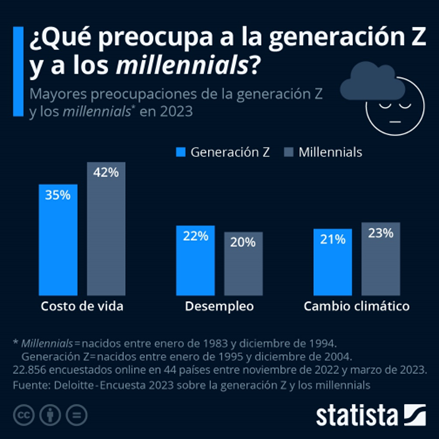
10. Statistical infographic. What worries generation Z and millennials?, Statista.
The variety of infographis is immense and you have many sites at your disposal to facilitate your exploratory and learning process. Start designing creative infographics and increase your income.
Tips for impactful and effective infographics
Creative and effective infographics have great power to provide information in a striking way, capturing attention immediately.
To achieve this, follow these tips:
Be clear in the message, using concise visualizations and a coherent structure.
Maintain a clean and balanced design that highlights the most relevant information, avoiding saturation.
Use readable fonts and an appropriate size to facilitate reading.
Keep a consistent style in your design for a cohesive presentation.
Choose a template designed for easy distribution on social media and other channels.
By applying these tips, you will be able to create impactful and effective infographics. Are you up for it?


 Freelancer tips