Flowcharts: Concept, Symbols, Steps, and Practical Examples
What is a Flowchart?
A flowchart or flow diagram is a method that presents information in a visual format, similar to an infographic. This is made possible through a system that uses symbols to explain the stages and decisions of a process, as well as the sequence of actions to follow. Essentially, it's a tool to visualize and understand the logic of a process from start to finish.
Benefits of Creating a Flowchart
These diagrams can benefit freelancers in a variety of fields, such as engineering, programming, project management, production, and more.
Among the benefits, we can highlight:
Task Organization. Flowcharts allow for the clear organization and structuring of tasks, facilitating the tracking and management of complex projects.
Clarity. They accurately show a process or system, making the sequence of actions and decisions easier to understand.
Effective Documentation. A flowchart is an effective tool for documenting what needs to be done, allowing teams and collaborators to quickly understand their tasks and how things work.
Standards and Consistency. They can help establish solid standards and procedures within an organization, ensuring that everyone involved follows the same steps and practices.
As you can see, a flowchart is as beneficial as an Ishikawa diagram. Not only because it serves to visualize and communicate information, but also because it is viable for simple or complex data.
Why Should Freelancers Use Flowcharts?
There are several reasons why you should take advantage of flowcharts as a freelancer.
Firstly, they allow you to identify and eliminate bottlenecks, reduce execution times, and improve task execution efficiency. Additionally, this system simplifies communication with your clients and collaborators.
You may also identify potential opportunities by visually mapping workflows. This includes automating repetitive tasks, delegating responsibilities, or optimizing the quality of the services you offer.
Flowchart Symbols
Flowchart symbols are graphical elements. These represent different decisions, processes, actions, or conditions within the workflow.
We'll show you the most common symbols:
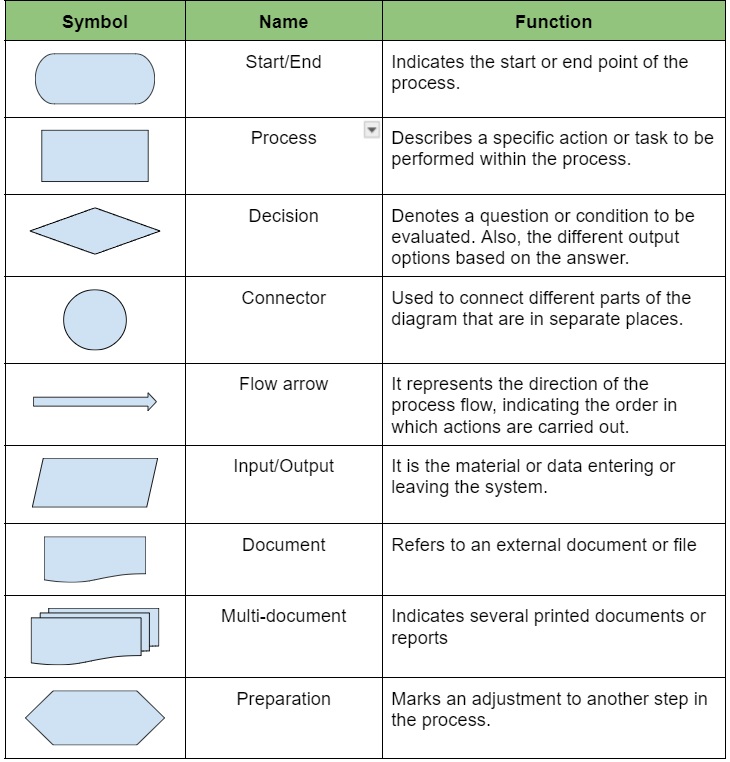
These elements are only some of the many components of a flowchart. Therefore, there may be variations in the symbols or the way they are represented, depending on the standard or convention used.
Types of Flowcharts
There are several types of flowcharts that can be applied in different contexts. Each one serves various purposes, with the most common ones being the following:
Process Flowchart. The most basic type, useful for understanding the steps and decisions necessary to complete a task or project. Popular among engineers and software developers.
Data Flowchart. Focuses on the representation of data transfer between different parts of a system. It is commonly used to model and analyze data movement within a process or information system.
Programming Flowchart. Also known as an algorithm flowchart. Used by programmers to graphically represent the flow of control of an algorithm or program. This way, they can understand its logic and debug the code more easily.
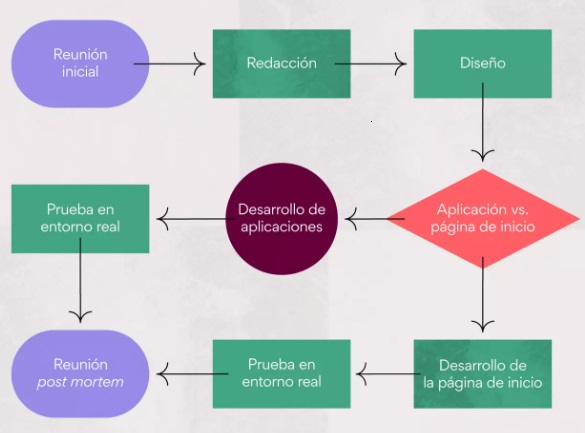
Workflow Diagram. Used to represent the phases or steps in a work process or project. It is useful for viewing and coordinating the activities of several people or teams within an organization.
Just like these, there are many other specialized types used in different fields and disciplines. The choice depends on the context and the purpose for which it is intended.
Steps to Create a Flowchart
Just like with a SWOT analysis, a flowchart allows for better evaluation and understanding of a situation. That's why you should know how to create one, and we explain it step by step:
1. Define the Objective. Before you start, you must be clear about the process or system to be represented in the diagram and what the goal of creating it is.
2. Identify the Stages. Make a list of all the phases or activities that are part of the process to be represented. This gives you an overview and allows you to plan the structure of the diagram better.
3. Choose the Symbols You Will Use. Select those that best symbolize the ideas, actions, and conditions within the flow.
4. Draw the Diagram. For speed, opt for diagramming software, such as Lucidchart or Draw.io, to design the flowchart. Place the symbols in the correct order and connect them with arrows to indicate the direction of the process flow.
5. Review and Improve. Once you have it ready, review it and make sure it is accurate and clear. Anyway, you can adjust it to optimize the results.
You can also share it with other interested parties to receive feedback, which will help you identify possible improvements.
10 Examples of Flowcharts
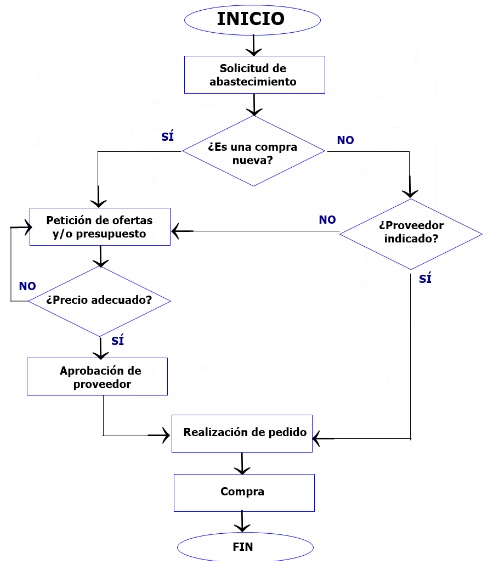
If you're not sure where to start, we present 10 examples of flowcharts to inspire you:
1. Process Flowchart.
2. Workflow Diagram.
3. Data Flowchart.
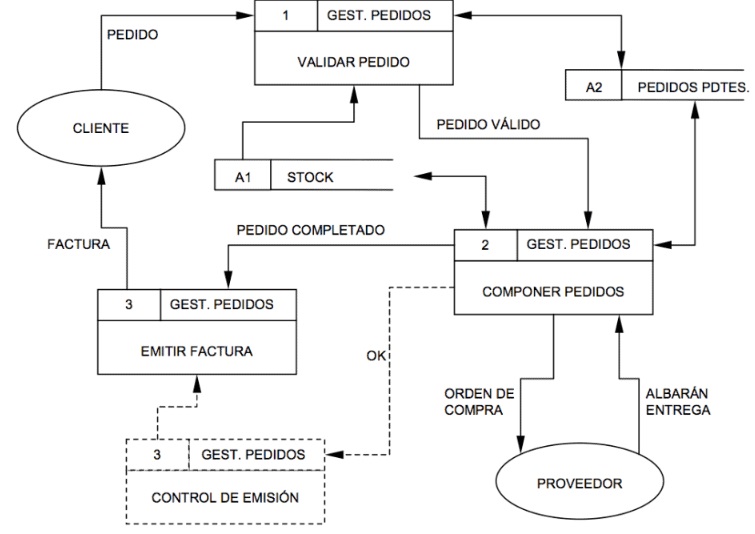
4. Programming Flowchart.
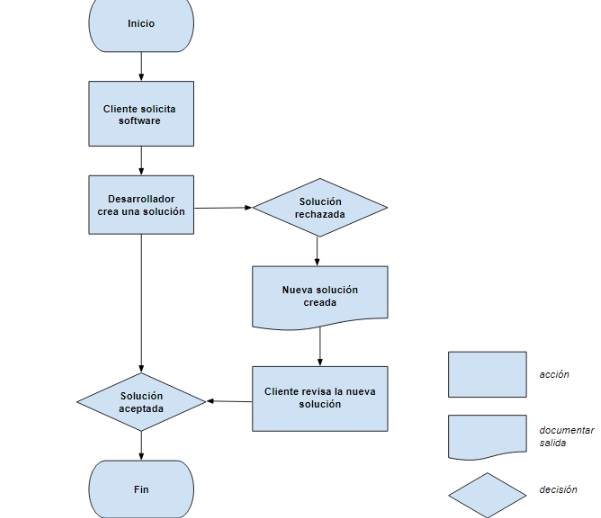
5. Process Flowchart.
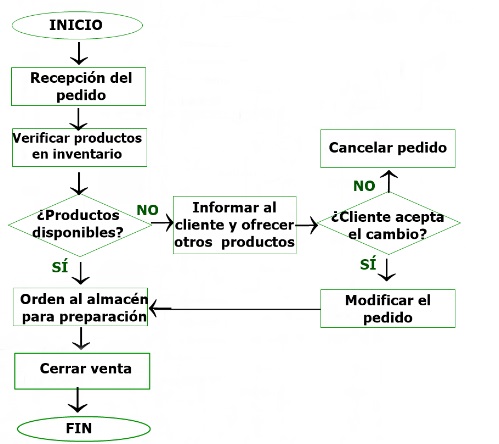
6. Programming Flowchart.
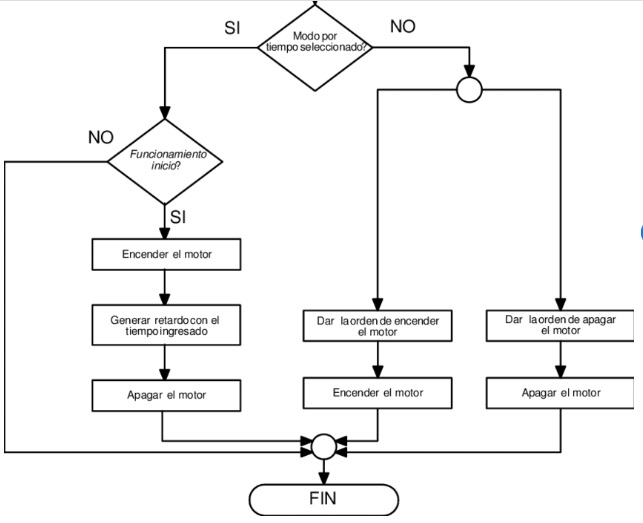
7. Process Flowchart.
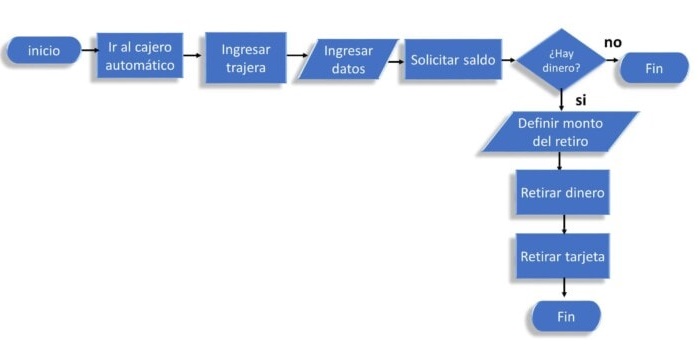
8. Algorithm Flowchart.
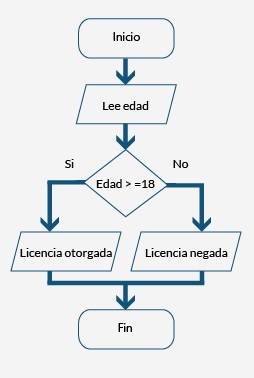
9. Data Flowchart.
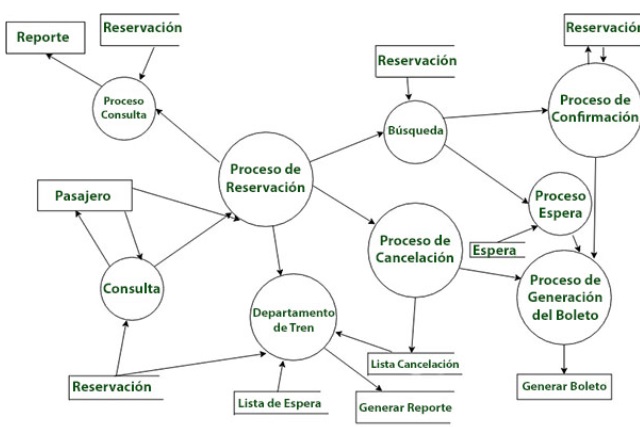
10. Algorithm Flowchart.
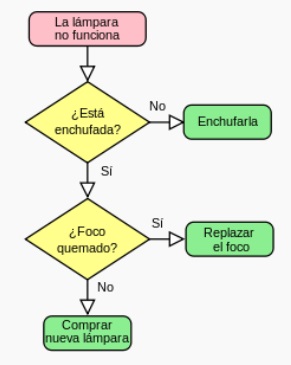
5 Tips for Creating a Good Flowchart
If you decide to create a flowchart, read the following tips and start on the right foot:
1. Make sure you understand why you need it. Before starting your flowchart, understand its purpose, as it is essential to represent processes clearly and objectively.
2. Simplify the Design. Keep the diagram design as simple and clear as possible. Try not to overload it and be redundant so that it is easy to understand.
3. Be Consistent in Symbolism. Use logical and compact symbolism in the diagram. Make sure each symbol expresses the same meaning throughout the design and use a simple color palette.
4. Order Stages Coherently. Organize the process stages logically and sequentially. Ensure the diagram is easy to follow, and the connections between phases are clear and direct.
5. Include Comments and Notes. Add explanatory comments and notes to the graphic to provide additional information. This enhances reader comprehension and clarifies any confusing points.
Through a flowchart, decision-making is easier, especially if you work on large projects.
Lastly, we suggest considering DolarApp as your provider for receiving dollar payments if you have clients abroad. Then you just need to convert them to pesos, but don't worry, it will be at the best exchange rate.
 Freelancer tips