Graphic organizers are designed to make information more visual and easier to digest. They are tools that give you a canvas to plan, compare, and present your work professionally—whether you need to structure ideas, present proposals, or clearly visualize processes in your freelance work.
That’s why today’s topic focuses on what a graphic organizer is and its types. We also include illustrative examples for each so you can get an idea of their format, as well as basic examples in the freelance field.
Graphic Organizers: Definition, What They Do, Types, and More
What is a graphic organizer?
They are structured visual representations that show the relationship between concepts. Their value lies not only in appearance but in functionality—they help shape ideas, projects, or processes, making both comprehension and communication easier.
A graphic organizer is made up of key concepts, link words, and elements—including arrows, lines, or shapes that connect ideas.
Its goal is for content to be displayed logically, highlighting the primary ideas and how they relate to each other.
Graphic Organizers: What Are They For?
Allan Paivio’s dual-coding theory states that our brains understand information better when visual and verbal channels are activated simultaneously—meaning comprehension and retention improve.
Therefore, graphic organizers are functional tools for structuring thought and facilitating visual analysis of a topic.
That translates to usefulness in cases where you need to:
Map scattered ideas with no defined order—whether starting a project, defining a strategy, or planning content.
Visualize workflow clearly, identifying stages, priorities, and dependencies.
Detect key relationships between concepts or tasks that may appear isolated but together build a coherent message or system.
Compare proposals, concepts, or approaches for more informed decision-making.
Prepare presentations or exposés with hierarchical information.
Organize content for courses, articles, or portfolios.
Analyze problems or situations by breaking them down to understand causes, consequences, and possible solutions.
As a freelancer, these representations not only help you organize ideas but also communicate more clearly and professionally. That’s why it's important to know the different types of graphic organizers that exist.
Types of Graphic Organizers [+ Examples]
There are many types—each serving different needs. Some are geared toward idea organization; others toward decision-making or explaining processes.
As a freelancer, you don’t need to master them all, but you should know which ones will help you work more clearly, plan better, and communicate effectively.
Graphic organizers + illustrative examples:
Mind map
A mind map starts from a central idea and branches into related concepts. It helps organize thoughts non-linearly, detect key connections, and quickly visualize the big picture.
Illustrative example:
Ideal for brainstorming, content planning, or structuring projects.
Organizational chart
Represents the structure of a team, project, or company, showing roles, hierarchies, and lines of responsibility.
Illustrative example:
If you collaborate with multiple clients or teams, it lets you see who does what and how different areas/functions are related.
Concept map
A concept map connects ideas using linking words and helps explain complex ideas, plan course structures, or present clear proposals.
Illustrative example:
This type of organizer allows hierarchical organization—from general concepts to specific details.
Comparison table
A comparison table contrasts two or more elements according to various criteria. Its purpose is to identify similarities and differences easily.
Illustrative example:
Useful for analyzing tools, proposals, or solutions before making decisions, helping you compare options objectively and structurally.
Venn diagram
A Venn diagram shows zones of overlap and difference between two or more concepts, using interlocking circles to highlight commonalities and distinctions.
Illustrative example:
Ideal for comparing audiences, services, ideas, or projects.
Timeline
Timelines organize events or tasks chronologically, showing sequence and duration.
Illustrative example:
Helpful for identifying dependencies, anticipating deadlines, and clearly communicating how a job will unfold over time.
Ishikawa diagram
A creative graphic organizer that analyzes a problem by visualizing its possible causes grouped by category—also called a fishbone or cause-and-effect diagram.
Illustrative example:
Need to detect the origin of issues in projects? The Ishikawa diagram helps identify which factors are influencing an outcome.
Attribute wheel
A circular layout that organizes the key characteristics or qualities of a concept around a central idea.
Illustrative example:
As a freelancer, you can use it to define value propositions, build your ideal client profile, or structure content strategically.
Synoptic table
It organizes information in a hierarchical and schematic way using brackets or indentations.
Illustrative example:
Like other formats, a synoptic table starts from a general topic to secondary ideas and details. Therefore, it favors a clear, orderly and quick view of related concepts.
KWL chart
This divides information into three columns: what you Know, what you Want to know, and what you have Learned.
Illustrative example:
If you’re starting new projects, preparing proposals, or creating content, this organizer is helpful—not just for focus, but also to identify gaps and assess progress clearly.
These types of graphic organizers are smart strategies to better process information and turn it into action. So don’t hesitate to use them to analyze data, organize thoughts, or build work frameworks.
How to Use Graphic Organizers Effectively
For a graphic organizer to truly help you as a freelancer, choose the right type based on your objective—like comparing, planning, summarizing, or solving a problem.
Once you know that, adapt the structure to the type of information you work with and the audience—whether a client, team, or yourself.
Follow these principles:
Choose with intention. If you’re evaluating options, use a comparison table; if explaining something complex, choose a concept map.
Be clear and visual. Avoid clutter—text should be simple and supported by lines, colors, or hierarchies that guide reading.
Align design with your message. The structure should reinforce, not complicate, your point.
Make it useful for you or your client. If it’s for personal use, focus on speed and functionality; if shared, pay attention to presentation and explain why you did it that way.
How to Make a Graphic Organizer: Example
1. Define your objective.
2. Gather key information.
3. Choose the type of graphic organizer that best suits what you want to communicate.
Example 1 – Venn Diagram:
If creating a value proposal to differentiate yourself from competitors, use a Venn diagram. Place what you offer, what others offer, and what the client truly needs. The intersection helps you focus your message.
Example 2 – Synoptic Chart:
If, on the other hand, you need to structure a service guide or a complex proposal, the synoptic table helps you to break down the contents by sections. In this case, you can detail key elements within each category.
You can do this very easily by using pre-designed charts online where you just replace data and customize to your liking.
If you work as a freelancer, these tools can be your strategic allies to plan and communicate with clarity. Integrating them into your workflow could make the difference between improvising and moving forward with focus.
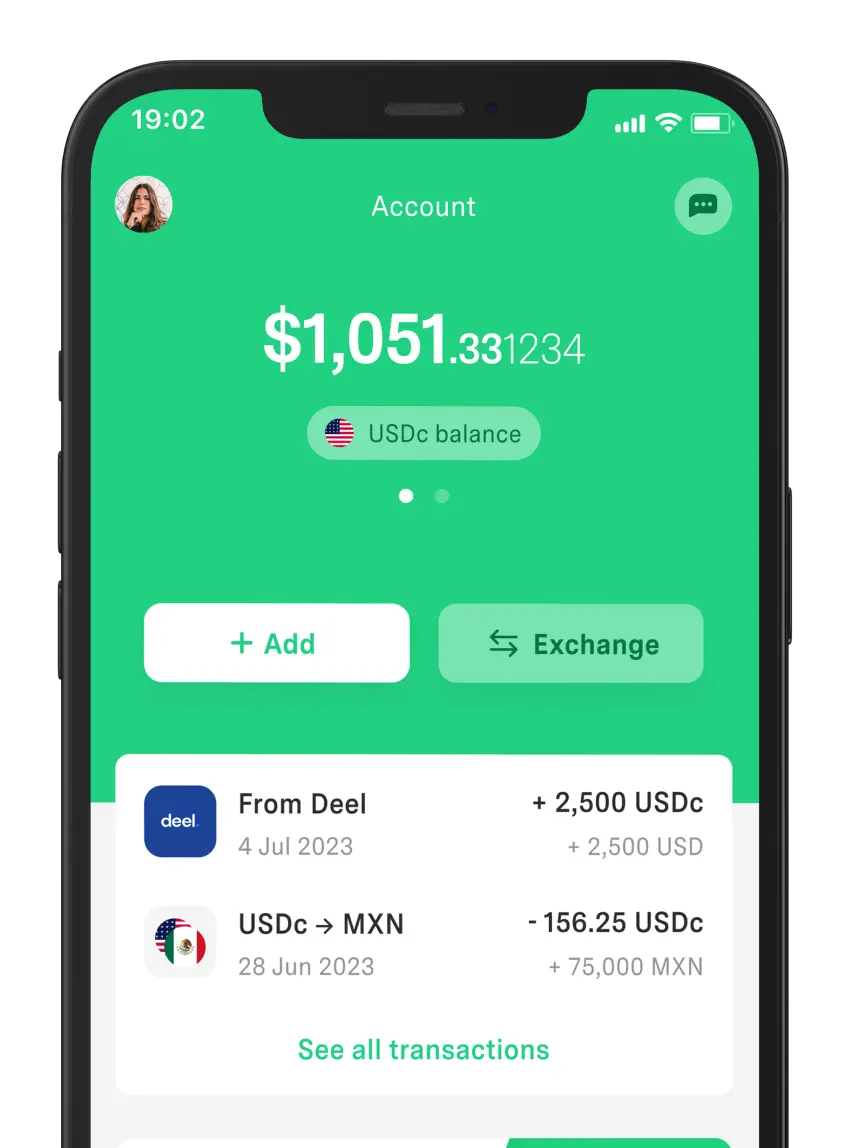
Finally, we recommend you to use our application to charge for your freelance services.
DolarApp works with digital dollars (USDc) and you can create an account in just a few steps. In addition, we have a convenient exchange rate for when you want to convert them to pesos, with no additional fees.


 Freelancer tips