Measuring customer satisfaction has become a priority for companies seeking sustainable growth. In this sense, understanding what NPS is is key because it lets you evaluate the customer experience and their level of loyalty.
Net Promoter Score is one of the most widely used market research techniques globally. That’s due to its simplicity: you only need to ask a single question: How likely are you to recommend us to a friend?
That’s why in Mexico—and around the world—NPS is used by digital companies, SaaS, and service businesses. And if you want to learn how it’s calculated, what it’s for, and what its advantages and limitations are, just keep reading.
Net Promoter Score (NPS): What It Is and How It’s Calculated
What Is NPS?
It’s a metric that uses qualitative and quantitative data to measure customer satisfaction and the likelihood that they’ll recommend a brand, product, or service. The term Net Promoter Score was developed in the 1990s by Fred Reichheld and became popular in the early 2000s in the business world.
Today it’s used as a key indicator of customer loyalty and experience, especially in digital companies, SaaS, and services. This indicator matters because it allows you to evaluate the relationship between satisfaction, loyalty, and growth.
NPS Meaning: What Does NPS Stand For?
NPS stands for Net Promoter Score, an indicator that measures customer satisfaction and the likelihood of recommending a brand, product, or service. The goal is to gauge consumers’ loyalty to the company.
Unlike other indicators like CSAT, NPS doesn’t focus only on momentary satisfaction. With Net Promoter Score, the goal is to understand the intention to recommend, which reflects loyalty and a long-term relationship.
For this reason, this metric is considered the most comprehensive for measuring the customer experience (CX) and its impact on business growth.
How Does the NPS Survey Work?
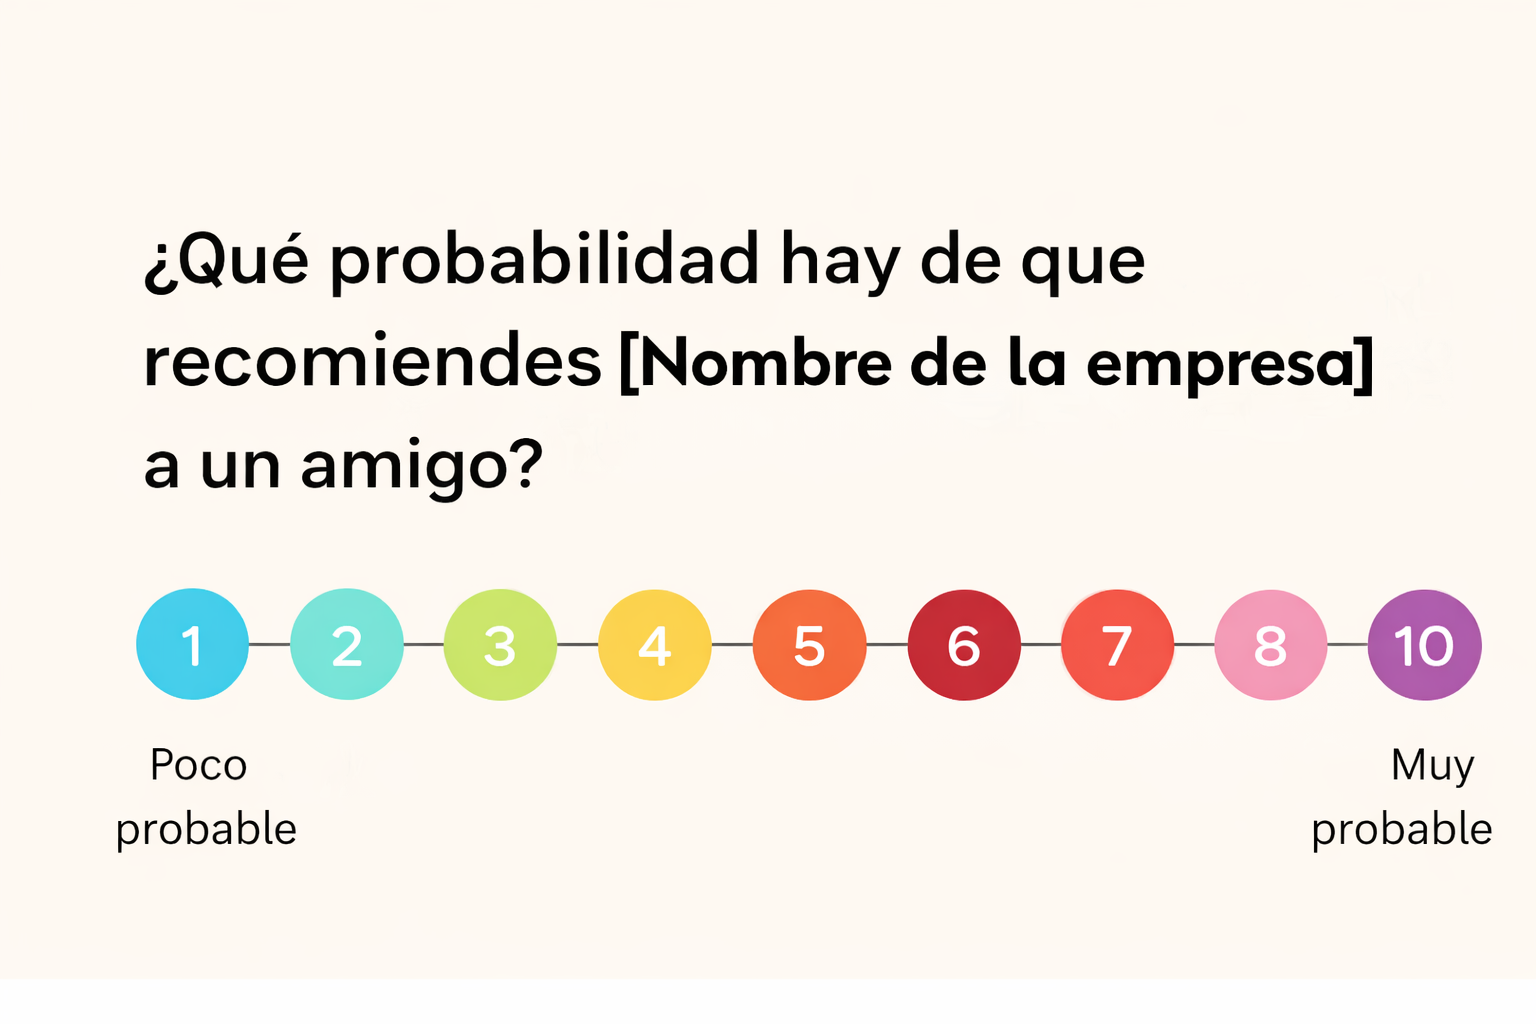
The Net Promoter Score survey works simply: you just need to ask the classic question and assign a 0–10 scale.
So, we can say the NPS survey works in three steps:
Distribution. You can run it in person or send it via email.
Add the NPS question.How likely are you to recommend [Company Name] to a friend? And add the scale as shown in the image.
Include follow-up questions. To better understand the results, add a few open questions like Why?—this will help you understand customer feelings and thoughts.
Tip: To keep the response rate healthy, keep the survey brief. Don’t use more than three questions and use clear, unbiased language to get better information.
Customer Types in NPS
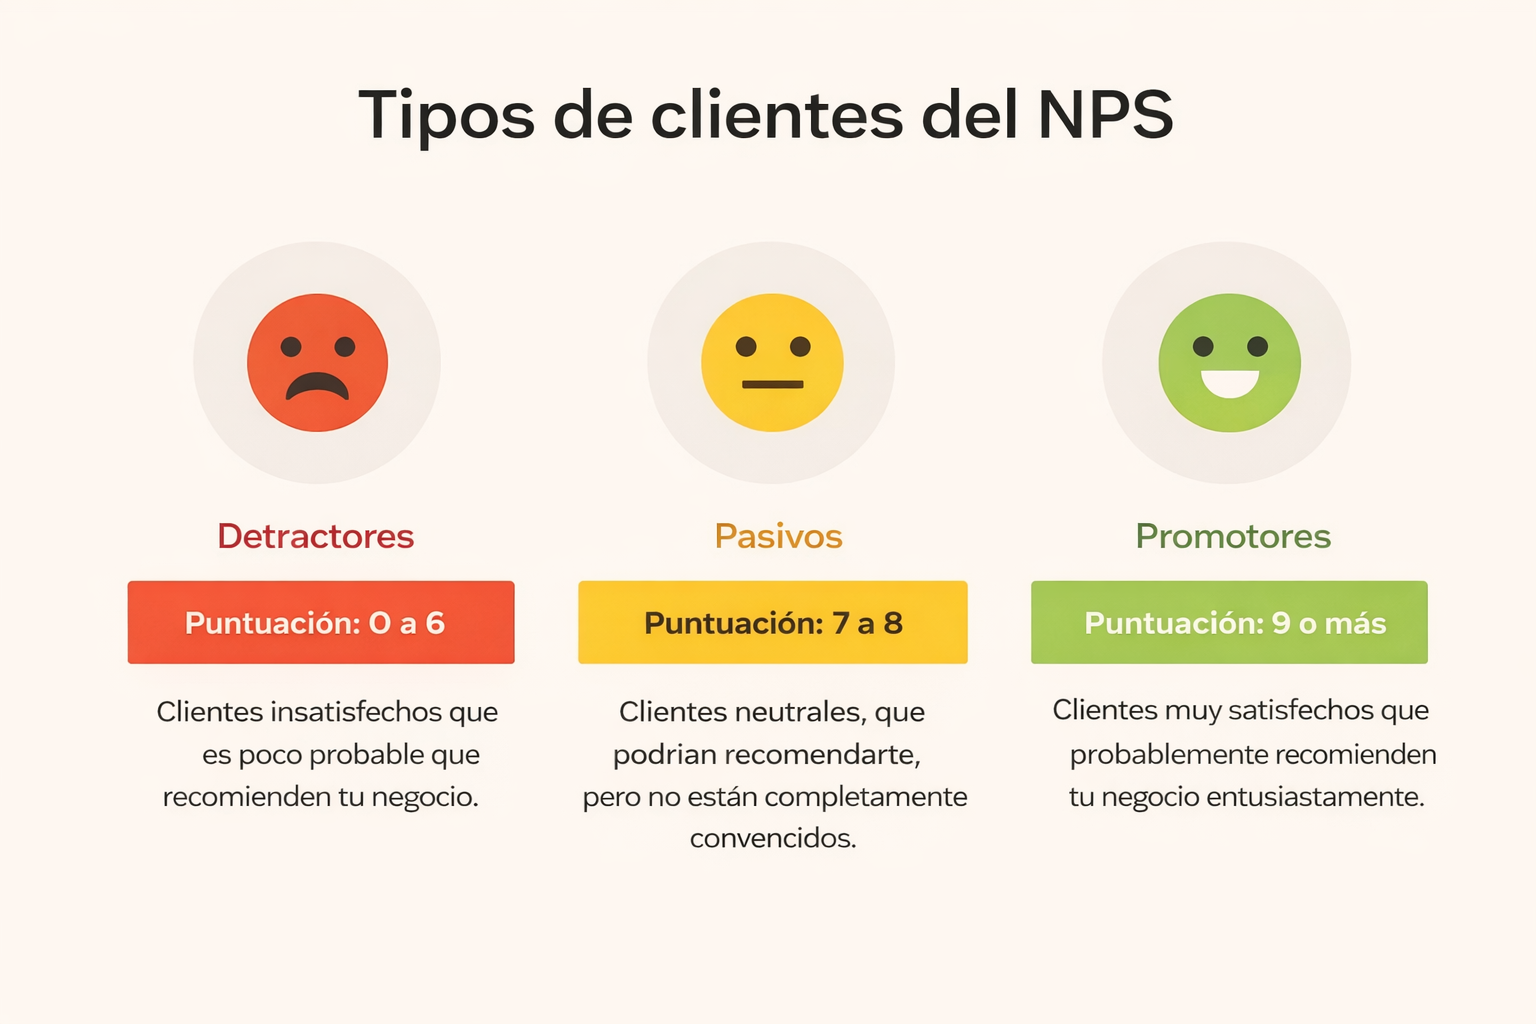
In NPS, customers are classified into three groups according to their level of recommendation:
Promoters (9–10). Customers who are very satisfied and loyal. They actively recommend the brand, make repeat purchases, and often become brand advocates.
Passives (7–8). They’re satisfied and likely to recommend the brand, but their bond with the company is not very strong. They can switch to a competitor if they see a better option.
Detractors (0–6). People who are dissatisfied with the product, brand, or service and can harm the business’s reputation with negative reviews. You can’t expect a recommendation from them.
By classifying your customers on this scale, it’s easier to make decisions to improve how your business is perceived and increase satisfaction. You can also use the information to improve processes that raise conversion of potential customers.
How Is NPS Calculated?
There are software tools that allow you to measure Net Promoter Score automatically, but here we’ll show you how to do it simply.
After running the survey, categorize the responses following the classification above:
0 to 6 (detractors)
7 to 8 (passives)
9 to 10 (promoters)
Once you’ve classified the NPS responses you collected, apply this formula:
NPS = % Promoters − % Detractors
Example: if 60% of your customers are promoters, 20% are detractors, and 20% are passives, the calculation would be: NPS = 60% − 20% = 40%.
Note: Customers who end up as passives are not included in the calculation because their sentiment isn’t defined (it’s not very strong). Still, it’s important to identify them for follow-up and to try to move them to the next level.
How to Interpret Net Promoter Score Results
To evaluate the result obtained from the NPS survey, use the following scale:
Between −100% and −1%: Poor
Between 0% and 49%: Fair
Between 50% and 74%: Very good
Between 75% and 100%: Excellent
So, what would be a good NPS result? Obviously, a good result would be having more promoters than passives and detractors. However, interpreting NPS requires understanding that there isn’t a single value that applies to all companies.
What’s considered a good, average, or excellent NPS depends on the industry, business model, and customer type. For example, digital companies or SaaS often have different expectations than traditional services.
Industries with low competition tend to have lower averages than mass-consumption sectors.
That’s why it’s key to analyze NPS in context and compare it with both internal and external benchmarks. You can even measure it for each of your sales channels and find that, within your own company, you can get different results.
What Is NPS Used For?
By applying NPS you’ll be able to understand how customers perceive your brand and how that perception impacts your business growth. In addition, with the results you’ll be able to:
Measure customer loyalty. You’ll know how willing customers are to recommend your brand, product, or service.
Detect problems in the customer experience. Analyzing responses from dissatisfied users will let you identify failures in your services or processes and make improvements.
Prioritize improvements. By combining NPS results with qualitative comments, you can decide which areas need immediate attention.
Reduce churn. Net Promoter Score provides specific data you can use to improve the user experience. This way, you’ll reduce churn or cancellation over time.
Make better decisions. With NPS you get direct customer feedback, which reduces assumptions. As a result, you can deliver products and services aligned with consumer expectations.
In short, NPS helps improve the customer experience, strengthen loyalty, and make better business decisions.
Advantages and Limitations of Net Promoter Score
This customer satisfaction metric has several advantages, but it’s not perfect—it also has limitations.
Advantages of NPS:
It’s easy to understand. The classification of promoters, passives, and detractors is well defined, which makes results easy to grasp.
Allows simple comparison over time. You can see over time whether customer satisfaction has improved, indicating whether your fixes worked.
Focuses on recommendations. Customer responses give you direct recommendations about points of dissatisfaction in your product, process, or service.
Can be run across channels. It’s easy to run the NPS survey via email, forms, WhatsApp, or on-site.
Limitations of NPS:
Doesn’t explain the “why” on its own. You need additional questions to understand the reason behind a customer’s satisfaction or dissatisfaction.
May vary by context. Satisfaction levels are tied to the type of business or service you provide, as well as the culture in the industry or country.
Requires complementary metrics. To get a clearer, more data-rich picture, you should combine NPS with other metrics like RFM, which lets you know a customer’s value and segment them.
Net Promoter Score (NPS) vs. Other Metrics
To compare NPS with other metrics like CES or CSAT, here’s a table showing what each measures.
Metric
What it measures
Best for
NPS
Loyalty and intention to recommend
Strategic view and health of the relationship medium/long term
CSAT
Satisfaction with a specific experience
Measuring the quality of an interaction, purchase, or support
CES
Customer effort to achieve an objective
Support, self-service, onboarding, digital flows
When you want to measure brand perception and loyalty, use NPS. If you want to measure specific moments like a purchase or support, use CSAT. If you’re looking to reduce friction and improve processes, CES is the better choice.
Final Words
NPS is one of the most important indicators for measuring customer loyalty and trust in a brand or business. Beyond a score, it offers a clear perspective on the user experience, revealing real opportunities for improvement. If you analyze the results correctly (with your context in mind) and add qualitative opinions, NPS lets you:
reduce churn,
prioritize improvement actions,
and strengthen long-term relationships with your customers. So if you’re not using Net Promoter Score yet, now’s the time to start.
And if you’re not using DolarApp yet to manage your finances transparently and safely, it’s time to start. We offer total transparency on fees and a fair exchange rate you can monitor in real time.
Frequently Asked Questions
What is NPS?
It’s a metric that measures the likelihood that a customer will recommend a brand, product, or service. It also helps evaluate customer loyalty and experience.
What does NPS mean?
NPS stands for Net Promoter Score, an indicator that reflects recommendation intent and the customer’s level of loyalty.
How is NPS calculated?
Net Promoter Score is calculated by subtracting the percentage of detractors from the percentage of promoters: NPS = % Promoters − % Detractors.
What is a good NPS?
A good NPS is positive and competitive within its industry, showing more promoters than detractors and a strong relationship with customers. It’s always important to consider your business context.
What is Net Promoter Score used for?
NPS is used to measure loyalty, detect experience problems, reduce churn, and make decisions based on real customer feedback.


 Freelancer tips